Analysis of User Quiz Response Using Machine Learning
1. Objective
The goal of incorporating machine learning into my project is for exploratory purposes to see if natural clusters emerge in the user data translating to archetypes. This analysis could segment users and be used for targeting as well as greater understanding of user demographics.
2. Dataset
2.1 Generating test data
I simulated expected real-world distribution of answers to generate enough test data for the model results to be interpretable and meaningful. I created a Python script that automatically writes user responses into the Django database thus creating sample quiz takers. It includes a dictionary of weights corresponding to expected distribution of users who would pick a particular choice in real life scenarios instead of utilizing a random selection of quiz choices.
For example, for the feature ‘miles_driven’, data suggest that most people in the U.S. drive ~250 miles per week, the question responses are more heavily weighted to this answer. In total, given there are 11 features as input to the model, I created 300 users or 3,300 data points.
2.2 Data Preprocessing
Preprocessing starts with retrieving all user responses from the database table, then pivoting to create one row per user indexed by unique session_ids. Then certain columns are dropped which were used as inputs to features of the model, e.g. car_type, and finally the index is dropped. Each feature is a column and the value is the calculated total CO2-equivalent per activity.
Due to the widely varying scales of each feature which might skew the model, for example emission for flights are magnitudes higher than dairy consumption, the data is scaled within columns using MinMaxScaler.
3. Methodology
3.1. Model selection
Clustering is an unsupervised machine learning technique which groups similar data points together. I decided to use the K-Means clustering algorithm because it is general purpose, efficient and very scalable. The algorithm minimizes within-cluster sum-of-squares (or inertia, the sum of differences between data points and the mean/centroid). In terms of the project, the algorithm assigns each user a label, placing them into a cluster based on similarity, including assigning the current user a label.
K-Means assumes that clusters are spherical (convex) and evenly sized (isotropic) compared to other methods like DBSCAN/HDBSCAN where clusters can be of uneven size. Another issue with K-Means is that in very high-dimensional spaces, Euclidean distances tend to become inflated (the ‘curse of dimensionality’). However, since these other methods can handle noise and thus assign users ‘-1’ labels, thereby discarding them, these methods wouldn’t work for my goals.
3.2 Choosing the optimal number of clusters (parameter tuning)
k-Means algorithm requires predetermining the number of clusters as an input parameter. One way to determine the optimal number is to use Silhouette analysis. Silhouette analysis can be used to study the separation distance between the resulting clusters. The silhouette plot displays a measure of how close each point in one cluster is to points in the neighboring clusters and thus provides a way to assess parameters like number of clusters visually. This measure has a range of [-1, 1].
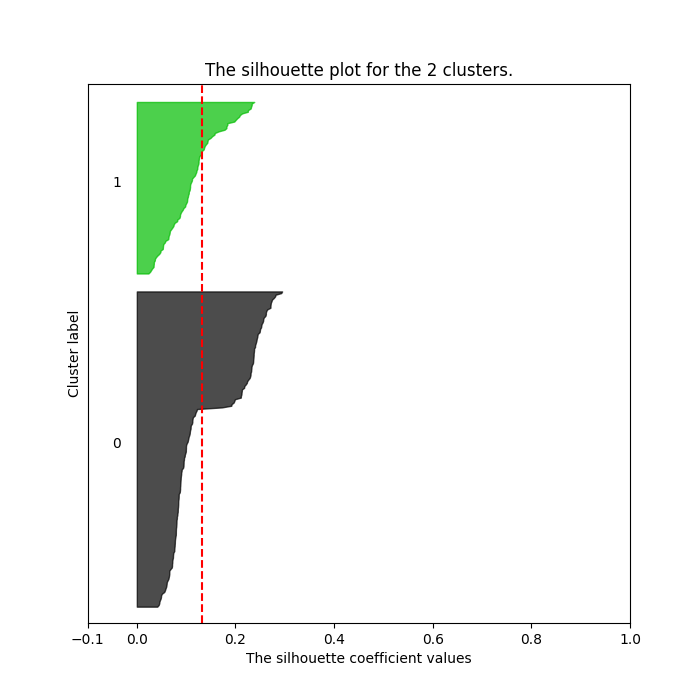
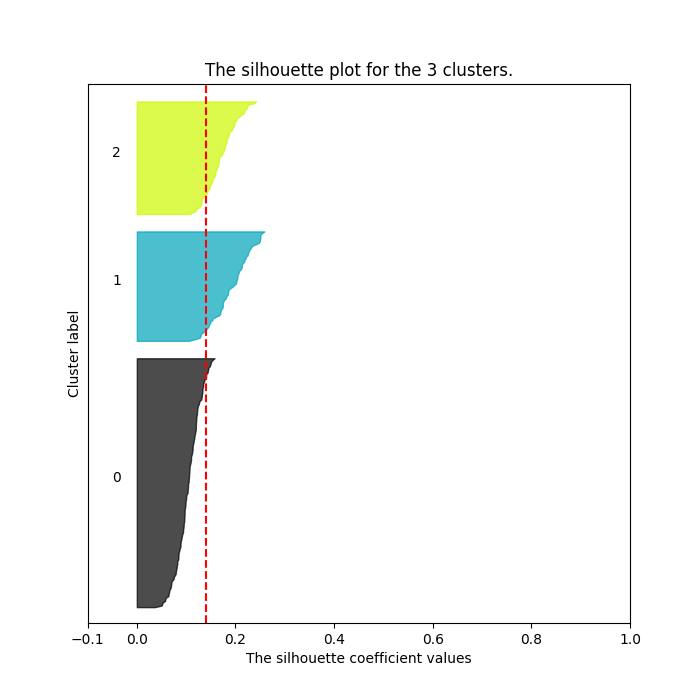
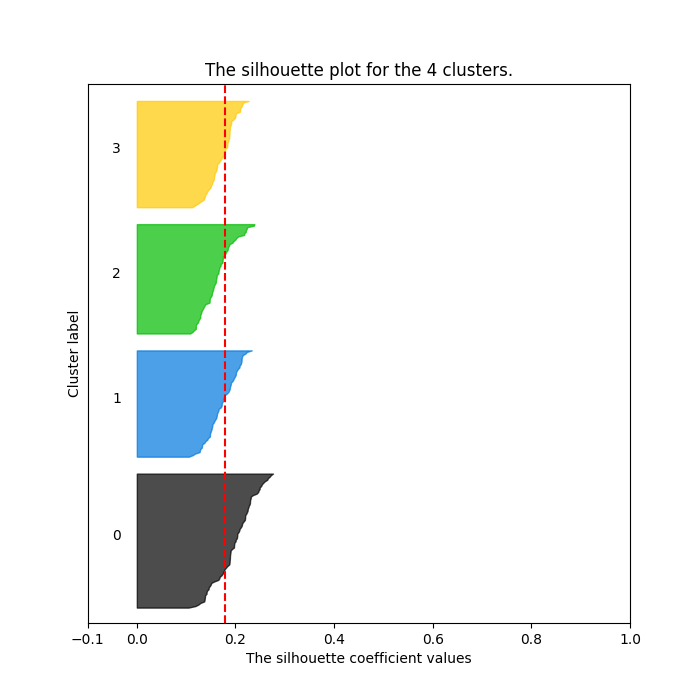
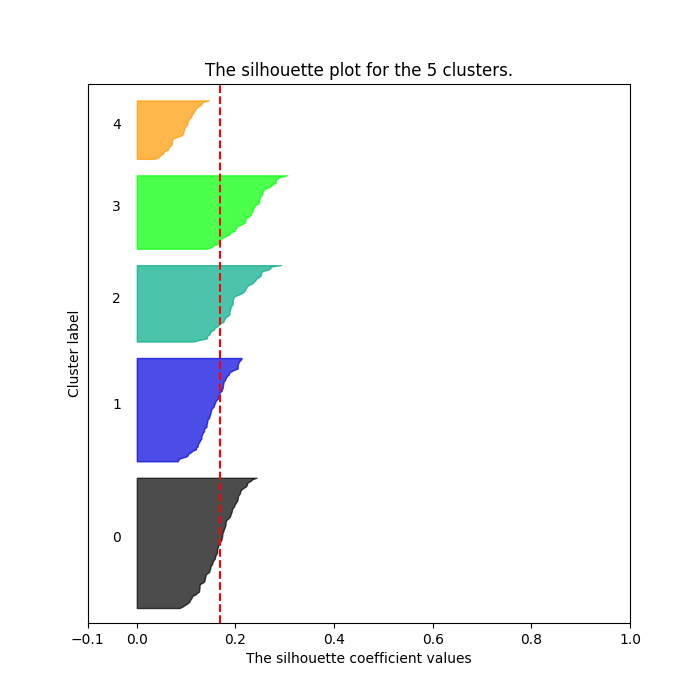
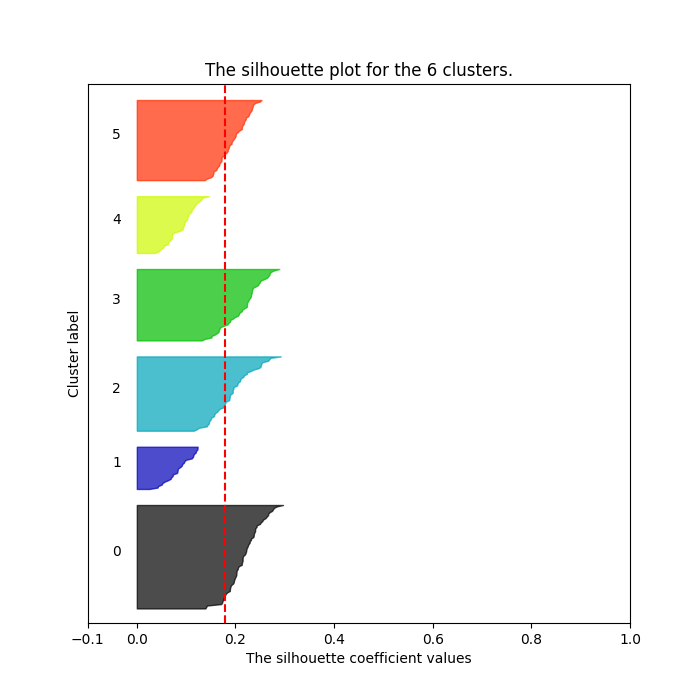
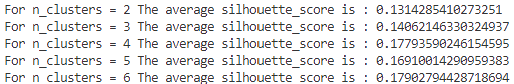
Although the averages are all relatively low with the highest being 0.17793590246154595 for n_clusters = 4 (values close to 0 indicates that the sample is on or very close to the decision boundary between two neighboring clusters), it looks like some clusters have formed. The chart for 4 clusters has 4 evenly distributed clusters with all of them hitting over the average silhouette score (vertical line in red).
Out:
4. Results & Interpretation
4.1. Model validation
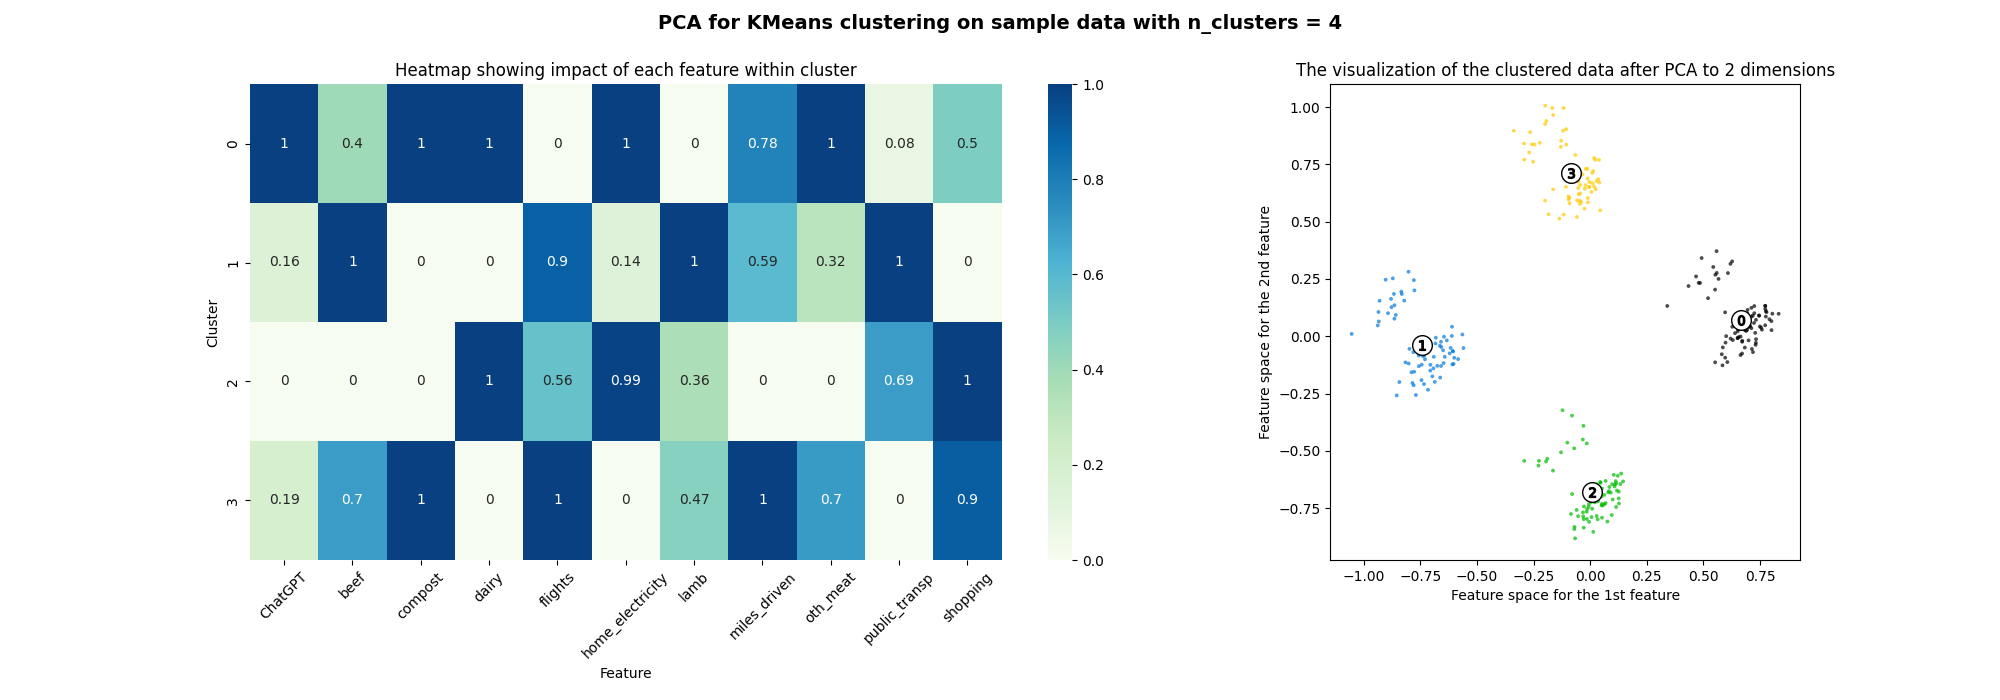
Based on Silhouette analysis I decided to go with 4 clusters with the results visualized below. I first used Principal Component Analysis (PCA) to reduce the dimensionality from 11 down to 2 so that the data can be visualized in 2D space. PCA finds new axes called principal components that best explain the variance in data.
Out:

In the scatter plot visualization of data in 2 dimensions, it seems like data is well separated into 4 clusters at first, then upon close inspection, cluster 3 (yellow), is spread out across the 4 clusters while cluster 1 (blue) is split in half as well. Cluster 2 (green) and cluster 0 (black) have data that are evenly distributed from their centers and the clusters themselves are well defined and separated. Potentially, the clusters are better separated in higher dimensional space since PCA is a linear transformation.
Explained variance ratios for the two axes are quite low at 0.17 and 0.15 further corroborates that the two dimensions do not explain the data well. Given the low Silhouette scores this lack of separation and definition also makes sense.
4.2 Analysis of resulting clusters
To see what each cluster means I also created a heatmap that shows the importance of each feature in the cluster. The clusters themselves don’t seem to provide much interpretation or typical archetypes one would expect for example ‘High-impact carnivores’ or ‘Low-impact composting vegetarians’. I think this makes sense given the relatively low separation of clusters as well as how test data was created.
5. Conclusion
In summary, applying K-Means clustering to simulated quiz data offered useful exploratory insights even though cluster separation was modest as reflected by low silhouette scores and variance explained by PCA. Visualizations indicated that while some groups were distinguishable, others exhibited overlap, underscoring the limits of clustering on high-dimensional synthetic data and the assumptions inherent to K-Means. Importantly, the feature heatmap revealed no clear archetypes which aligns with the nature of the synthetic dataset.
As real user data accumulates I expect to periodically retrain the model and update these results - the clusters are likely to become more meaningful. I also expect to cross-validate clusters with collected user demographics in the future.
This script is available in my GitHub repo.